Platform
Be

Commercial Analytics
Empowering hotel commercial teams to explore their performance from any angle

Finance Analytics
Transform Financial numbers into visual narratives. The finance module reignites your passion for numbers.

POS F&B Analytics
Become Revenue management driven across all streams and Unlock F&B profitability
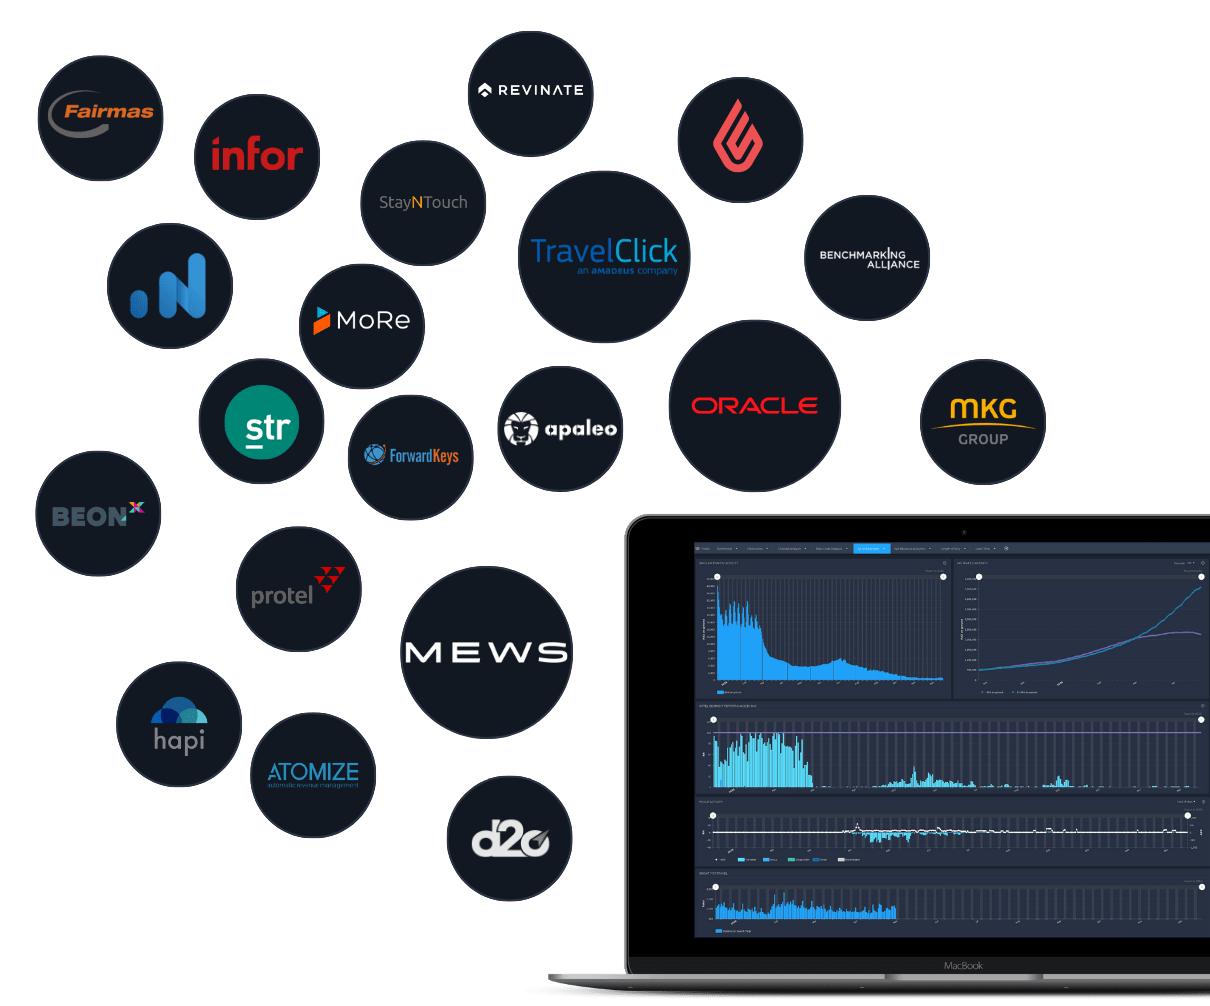
Juyo plays well with everyone
Juyo enables you to add external data sources in your dashboards: get creative with your data and extract maximum value.
Combine external data with your own and derive new insights that are not in the external tools.
At Juyo, we don’t just replicate what your other data tools do. Instead, we craft new and complimentary ways to enhance that data.
The Juyo Analytics Engine
The synergy of our analytics components coupled with the industry's most granular data model results into the world's most exceptional hospitality analytics experience.
Canvas
Creator Mode
Constellations
Pulse
Exploration
Deep dive
Table Designer
Iris – Chart Designer
Tuning

Juyo Data Visualization Platform
Where a Picture Speaks 10,000 Words
Create jaw dropping data analytics visualisations
With Juyo’s cutting-edge visual engine you can create and customise analytics visualisations that seamlessly integrate information from all your critical systems.
Improve your revenue leveraging data exploration
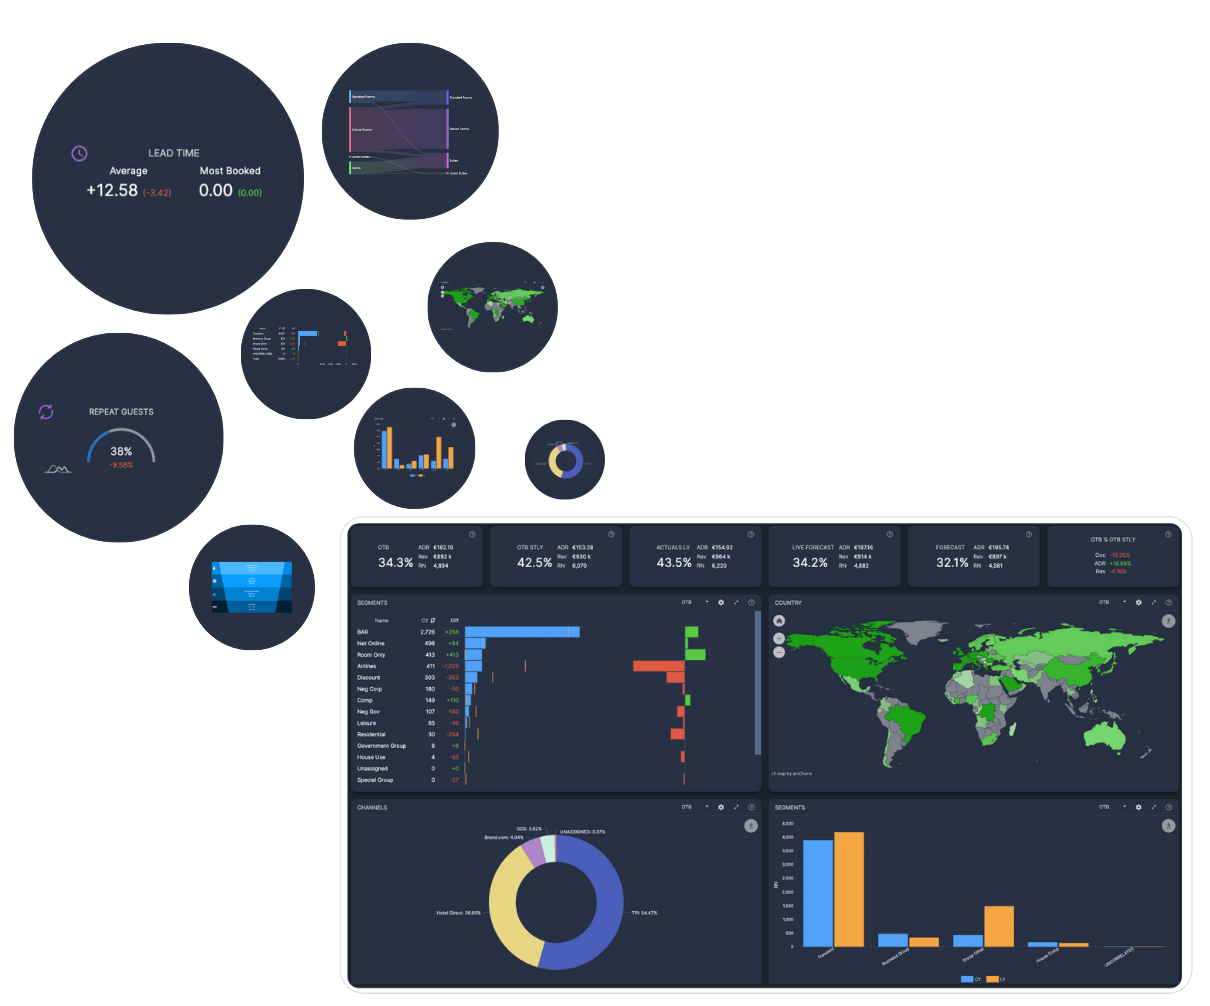
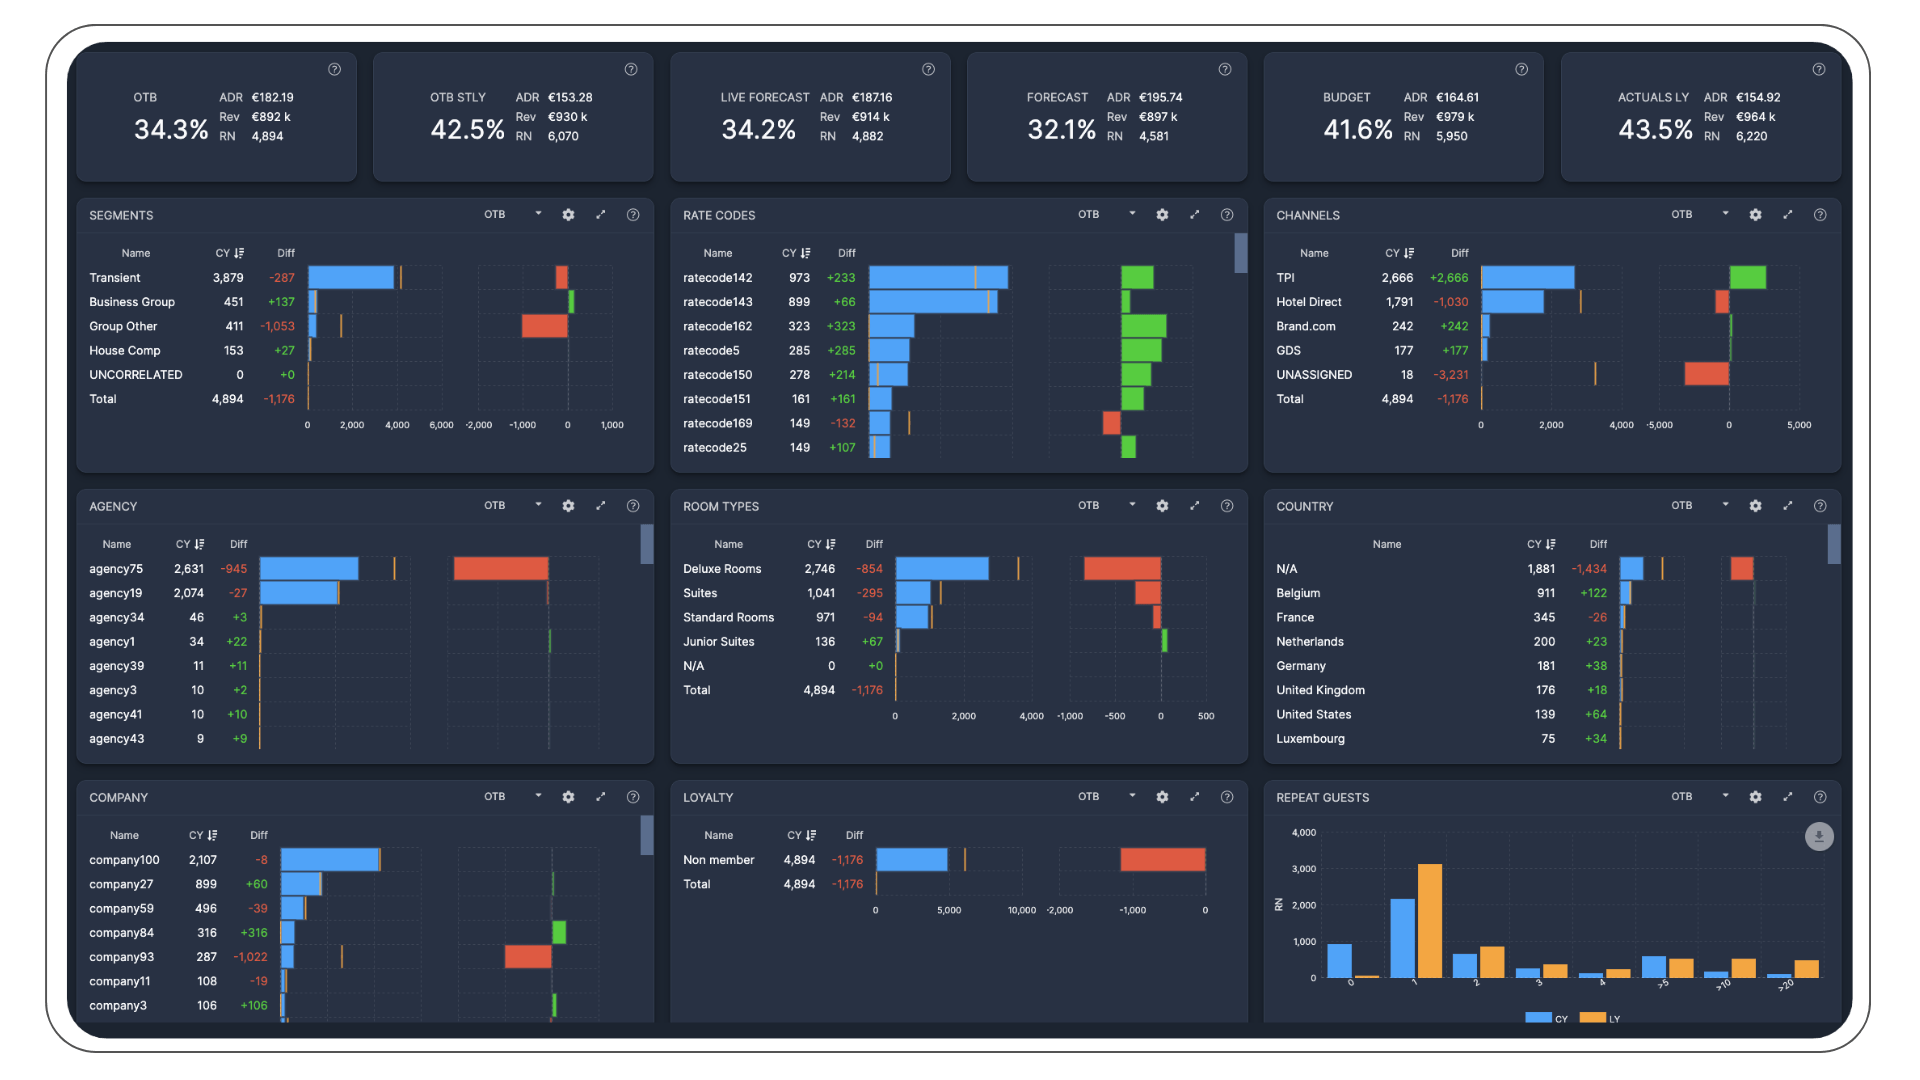
Achieve your property’s optimal business and channel mix, dive deep and slice and dice into segments, channels, rate codes, and all other booking dimensions to proactively respond to evolving booking behaviours, from length of stay patterns to occupancy trends.
Leverage external demand signals to outsmart your competition
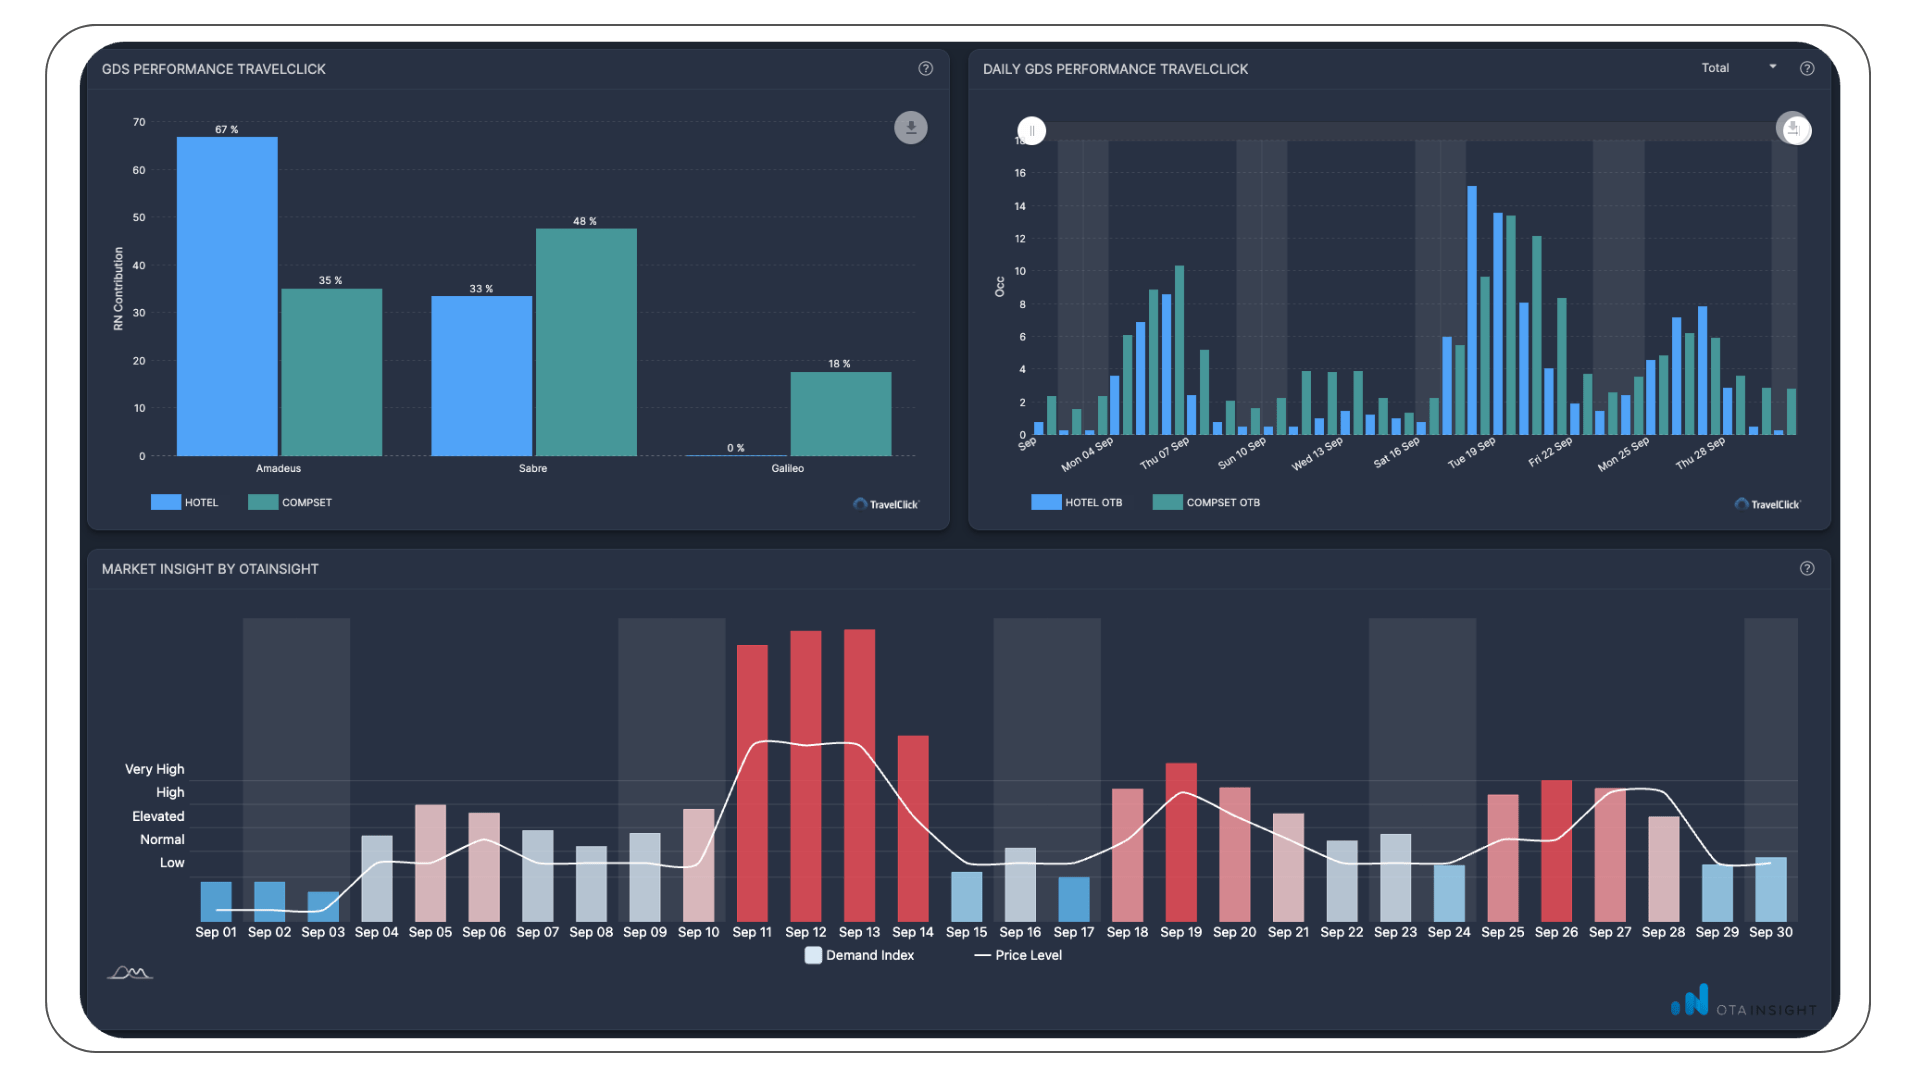
Unlock competitive insights by decoding rivals’ pricing strategies, fusing review and pricing data, integrating external sources, and monitoring demand signals from platforms like Demand 360 by Amadeus Travelclick, Otainsight, STR, airline arrival patterns and many more.
Measure Net Revpar & reduce distribution costs
Dive deep into your distribution costs and marketing spend, gaining clear insights into past and future Net ADR and RevPAR. Fine-tune your sales strategy, keep a keen eye on campaign ROI, and ensure your Net Revenue KPIs are in focus.
Launchpad – Forecast with Confidence
Build and maintain precise forecasts and budgets using smart spread algorithms, say goodbye to outdated Excel sheets, customize your data visualizations for a tailored business perspective, and enhance forecast accuracy while facilitating seamless communication across departments.”
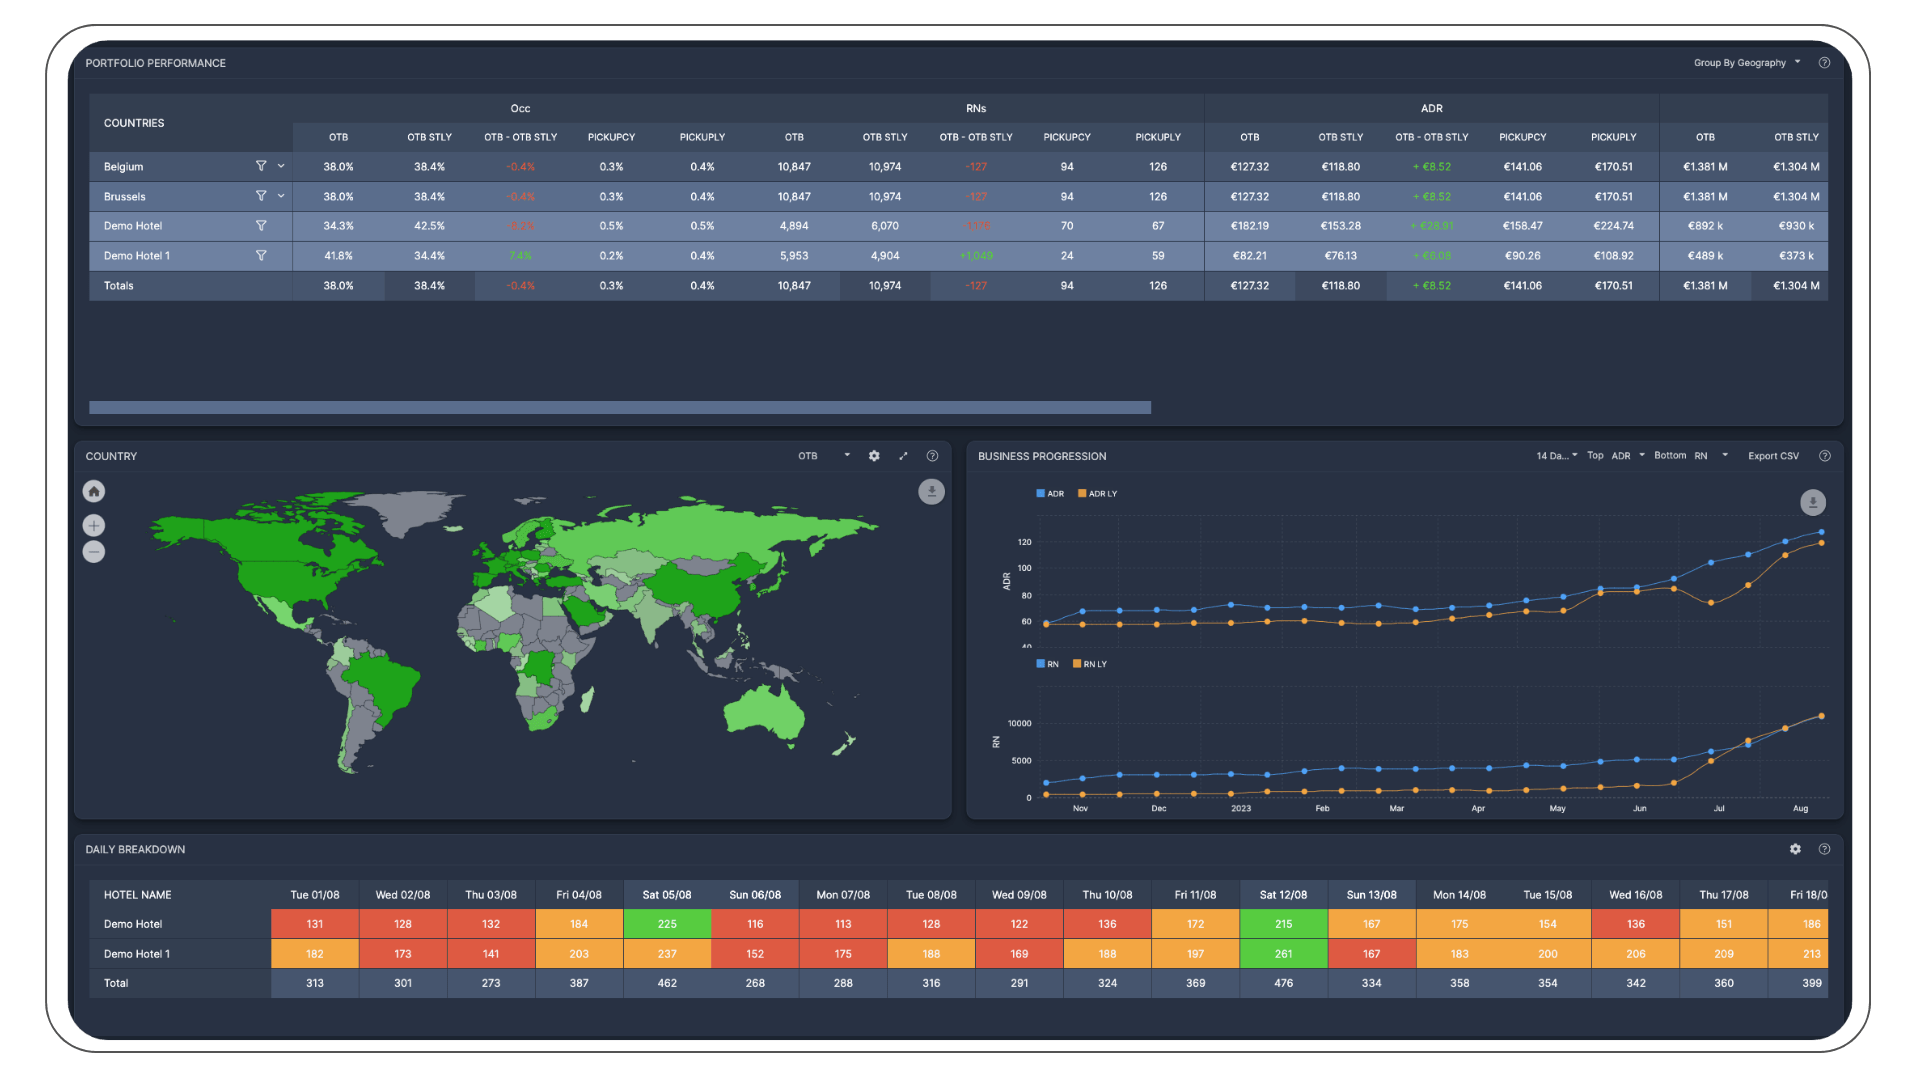
Analyse data across your portfolio
View unified, normalised data from all your hotels at a portfolio level. Dive into unlimited subgroups to analyse performance by brand, asset management, location type, and beyond. With Juyo, identifying new profit avenues and mitigating risks becomes second nature.
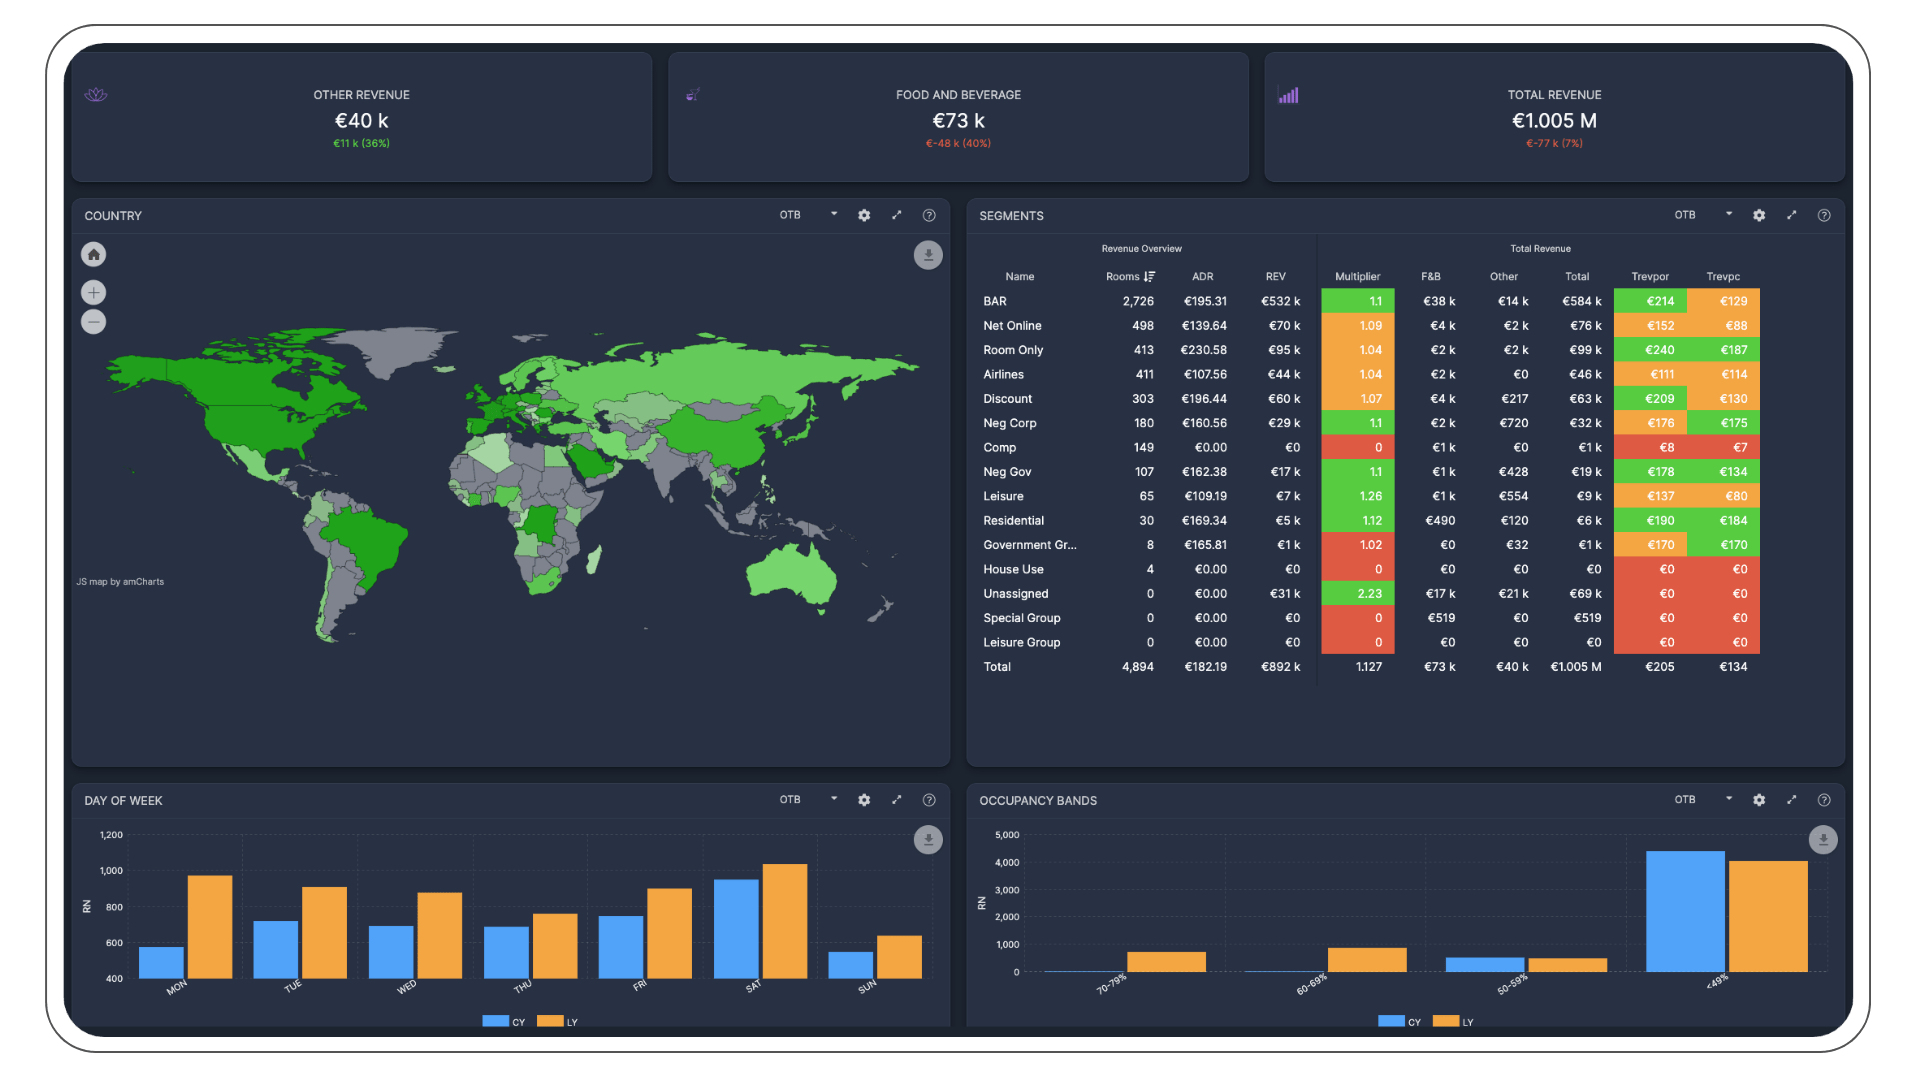
Master Total Revenue Management
Add new dimensions to your analysis by combining total spend and profitability at the customer level, enabling a deeper understanding of which customers drive more profit. This enriched perspective paves the way for tailored marketing strategies.
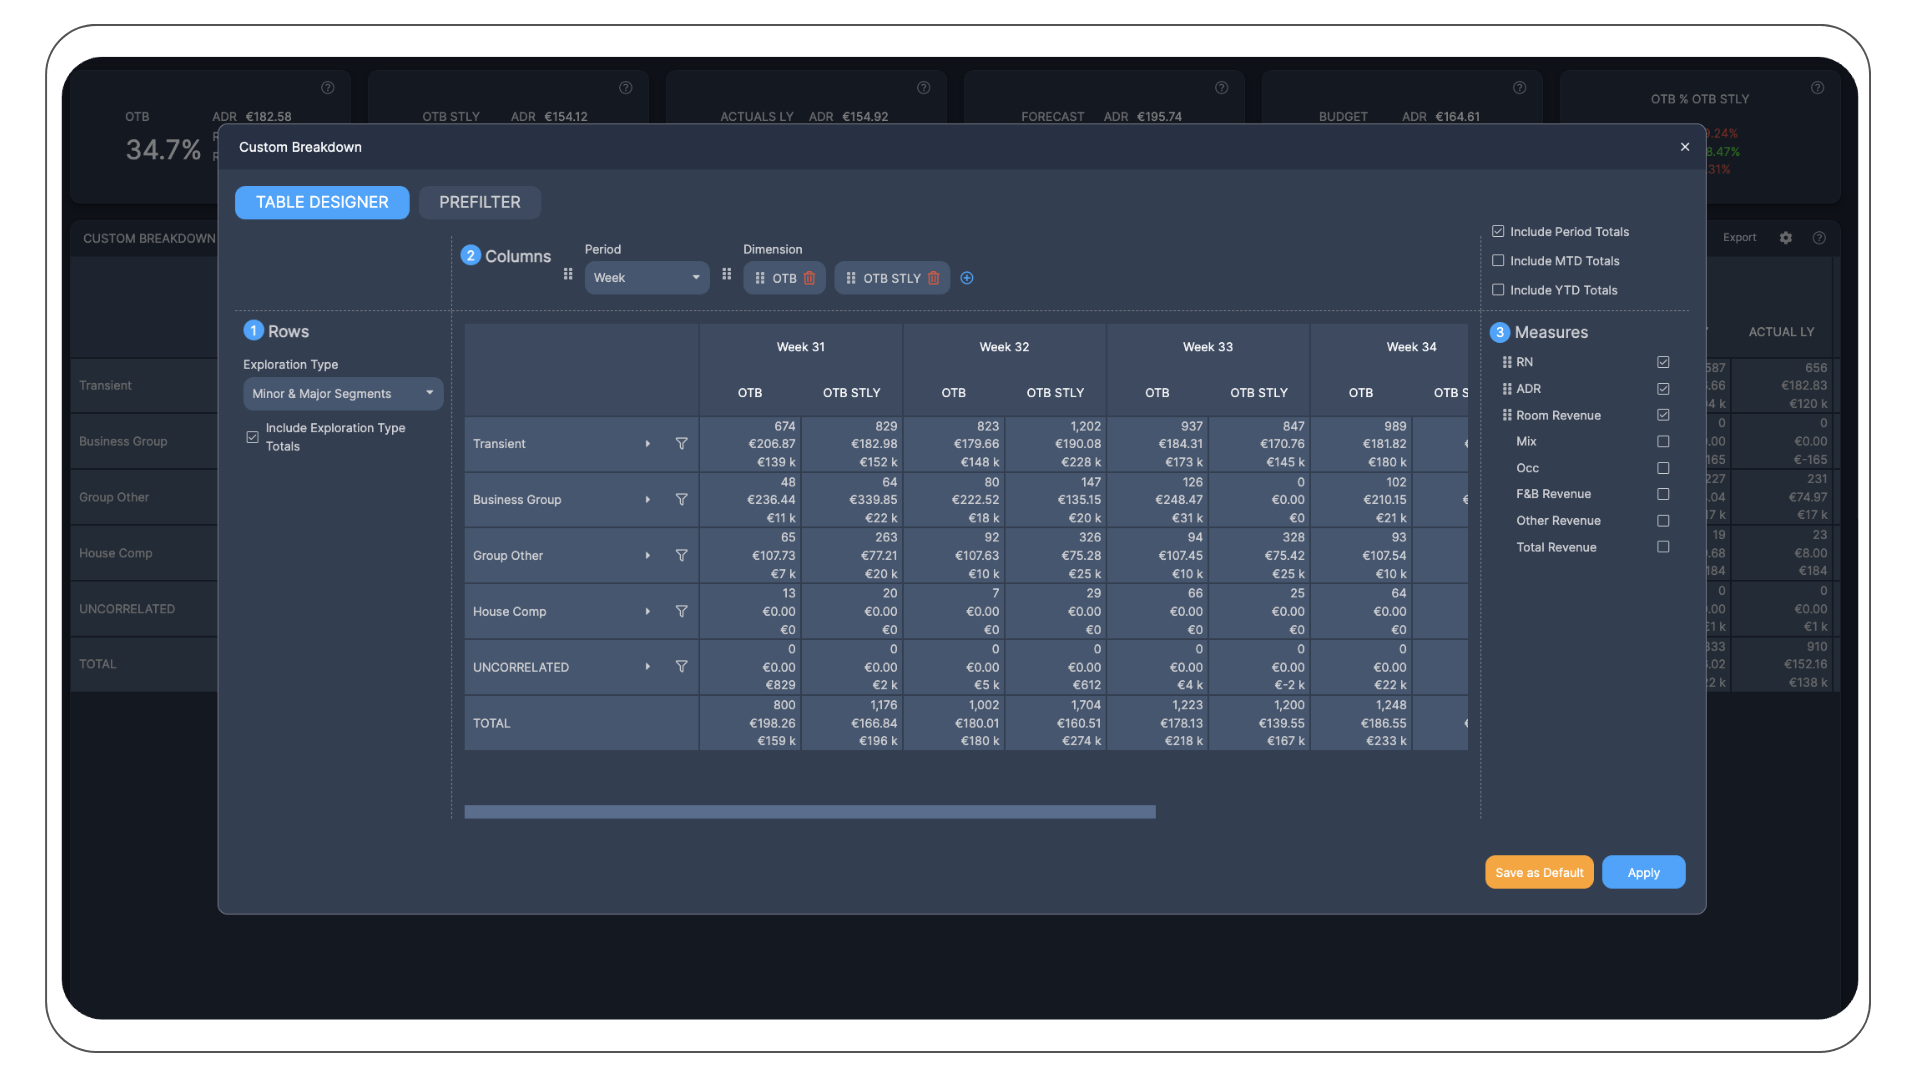
Designer: The ultimate data table creation tool
Designer empowers you to create data tables from scratch. Think of Designer as a robust pivot table on steroids. Select Dimensions, and build tables with unparalleled flexibility. Want a periodic breakdown? Designer lets you seamlessly integrate different time frames, providing a temporal perspective on your data. Hint: there is more to come 😉
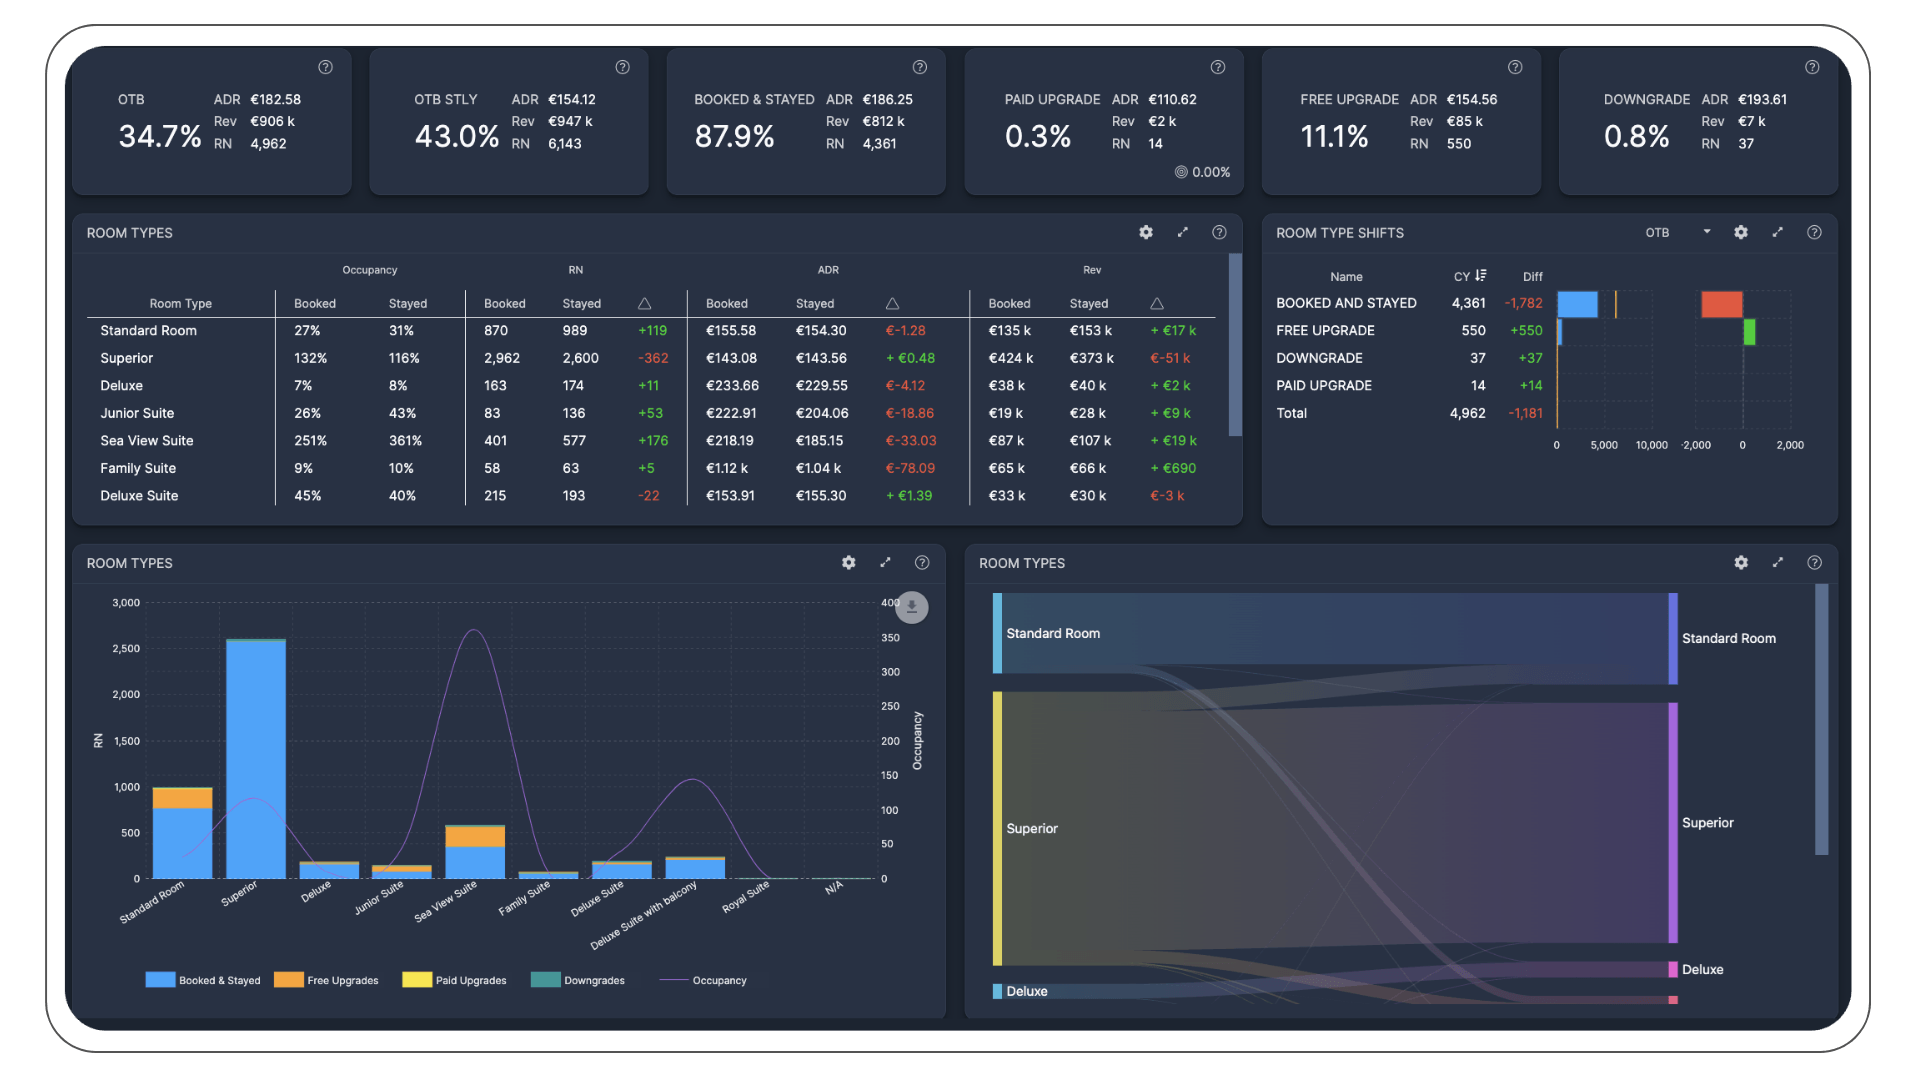
Analyze data by adding layers of context
Optimise every facet of your business. Master the nuances of room type dynamics with a keen analysis of booked vs. sold room types , highlighting upgrades, upsells, and downgrades. Strategize with precision by harnessing detailed accounts analytics. By understanding production patterns, you’re equipped to always stay ahead. And with tools to measure rate and sold-out efficiencies, you will operate at peak potential.
Group Analytics
Unlock Your Group Business Potential! Dive deep into group booking patterns, and fine-tune your inventory between blocked and picked up rooms
Integrate Finance
Revitalize your P&L structure down to the account level with unmatched flexibility, choosing precisely which business dimensions—you wish to display or conceal. Enrich your P&L with vibrant, color-coded custom calculations, from straightforward metrics like cost per occupied room to flowthrough.
Iris – Chart Designer
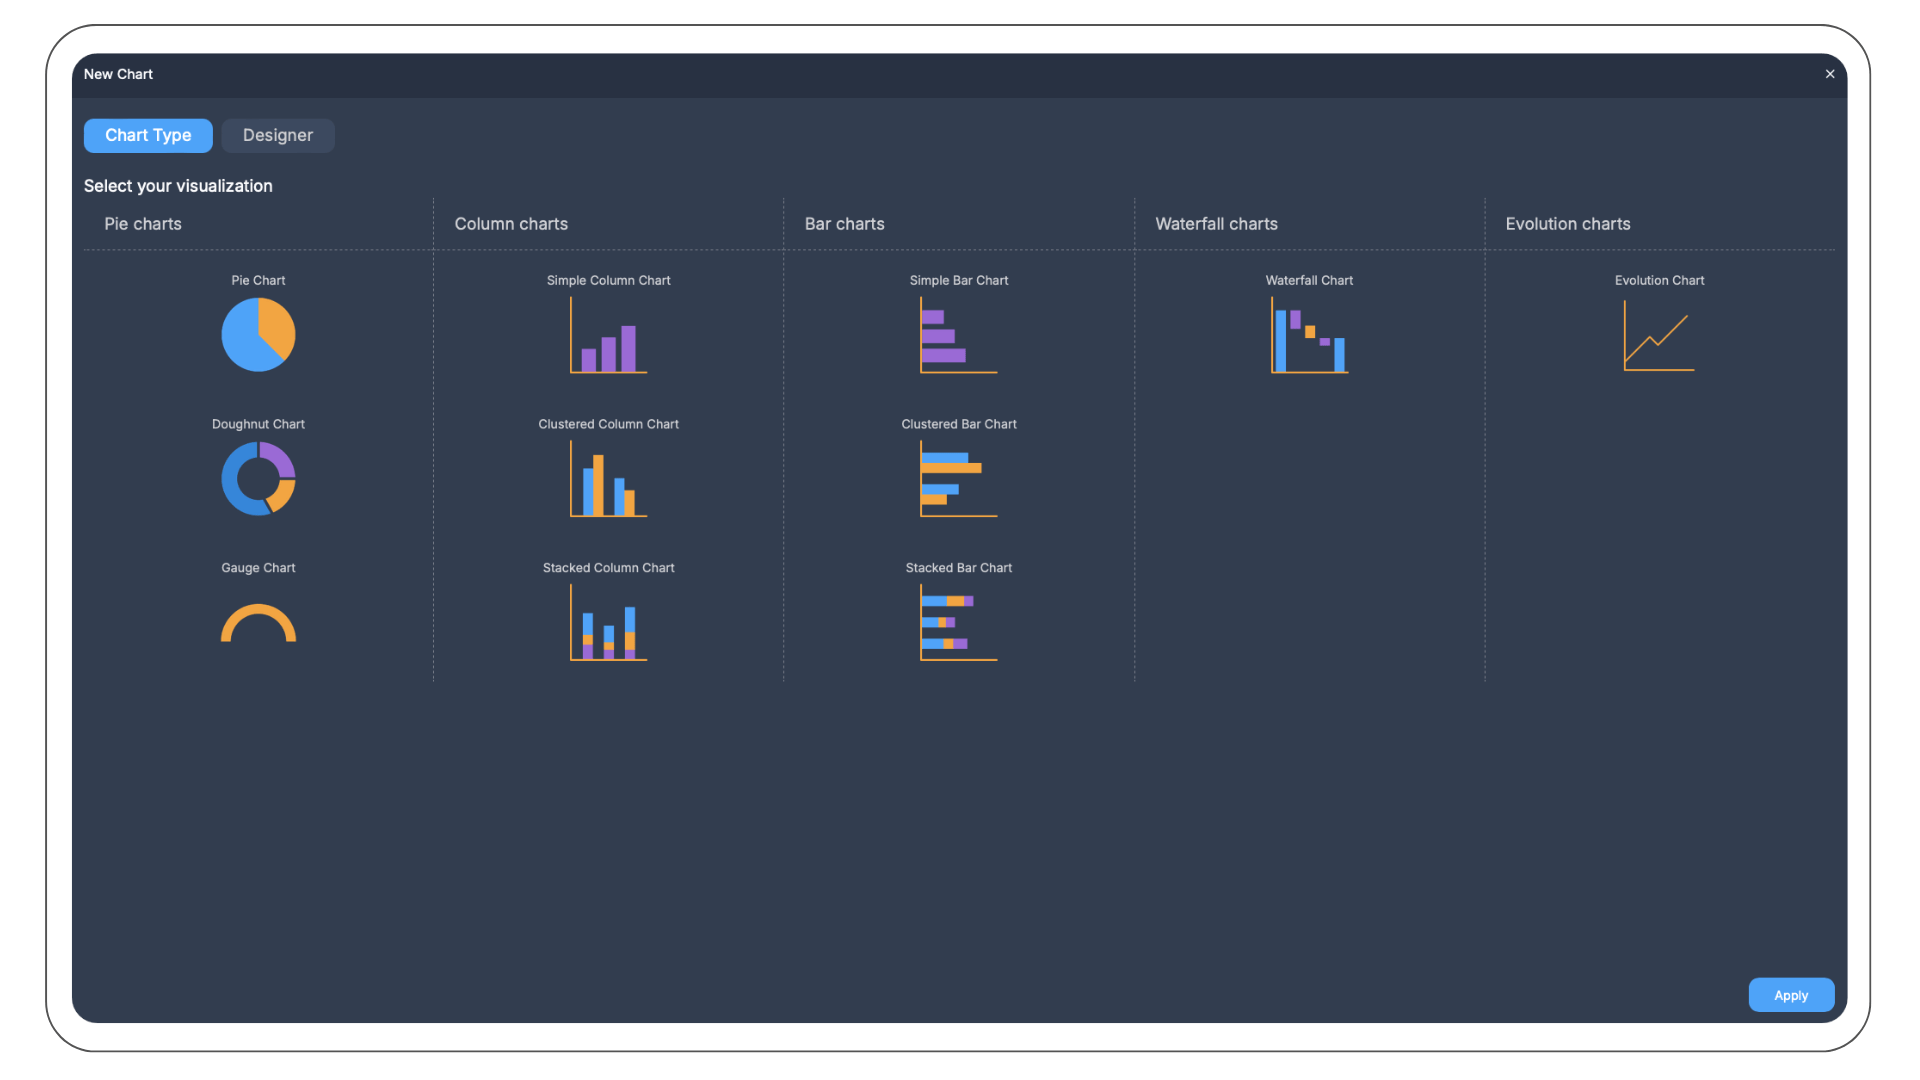
Iris is Juyo’s in-house built chart designer, developed to enhance your data visualization experience. With Iris, you can create charts from scratch, allowing for a high level of customization and precision tailored to your specific needs.
Currently, Iris is focused on Finance data, empowering you to generate insightful financial charts. However, Iris is set to progressively roll out to all parts of the application, broadening its impact. Iris will continue to increase in power and functionality over the next months
Finance P&L Designer
By combining Commercial and Finance data into one tool, we help you connect the dots between Sales, Revenue, and Finance teams more easily, promoting an integrated approach for your data management.
Revamp your P&L structure at the account level with unparalleled flexibility. Conceal or display any business dimensions you choose – be it Forecast, Budget, or LY.
Inject vibrant, color-coded, custom calculations anywhere in your P&L from cost per occupied room to complex percentage computations like flowthrough analysis and streamline your financial analysis.

Finance Visual Analytics
Transform your financial data into dynamic charts and interactive pulse widgets that offer deep, actionable insights. Instantly identify trends visually with rolling KPI’s and dynamically customisable widgets.
Empower Your Team with personalized dashboards that cater to both portfolio-wide and individual hotel-level performance, ensuring each team member can focus on the metrics that matter to them most.
Maximize Profitability Through Conversion Analytics. This enables hotel management and ownership to break down profitability into its core elements and rebuild it into an optimised, and sustainable profit model.

Meeting and Events Analytics
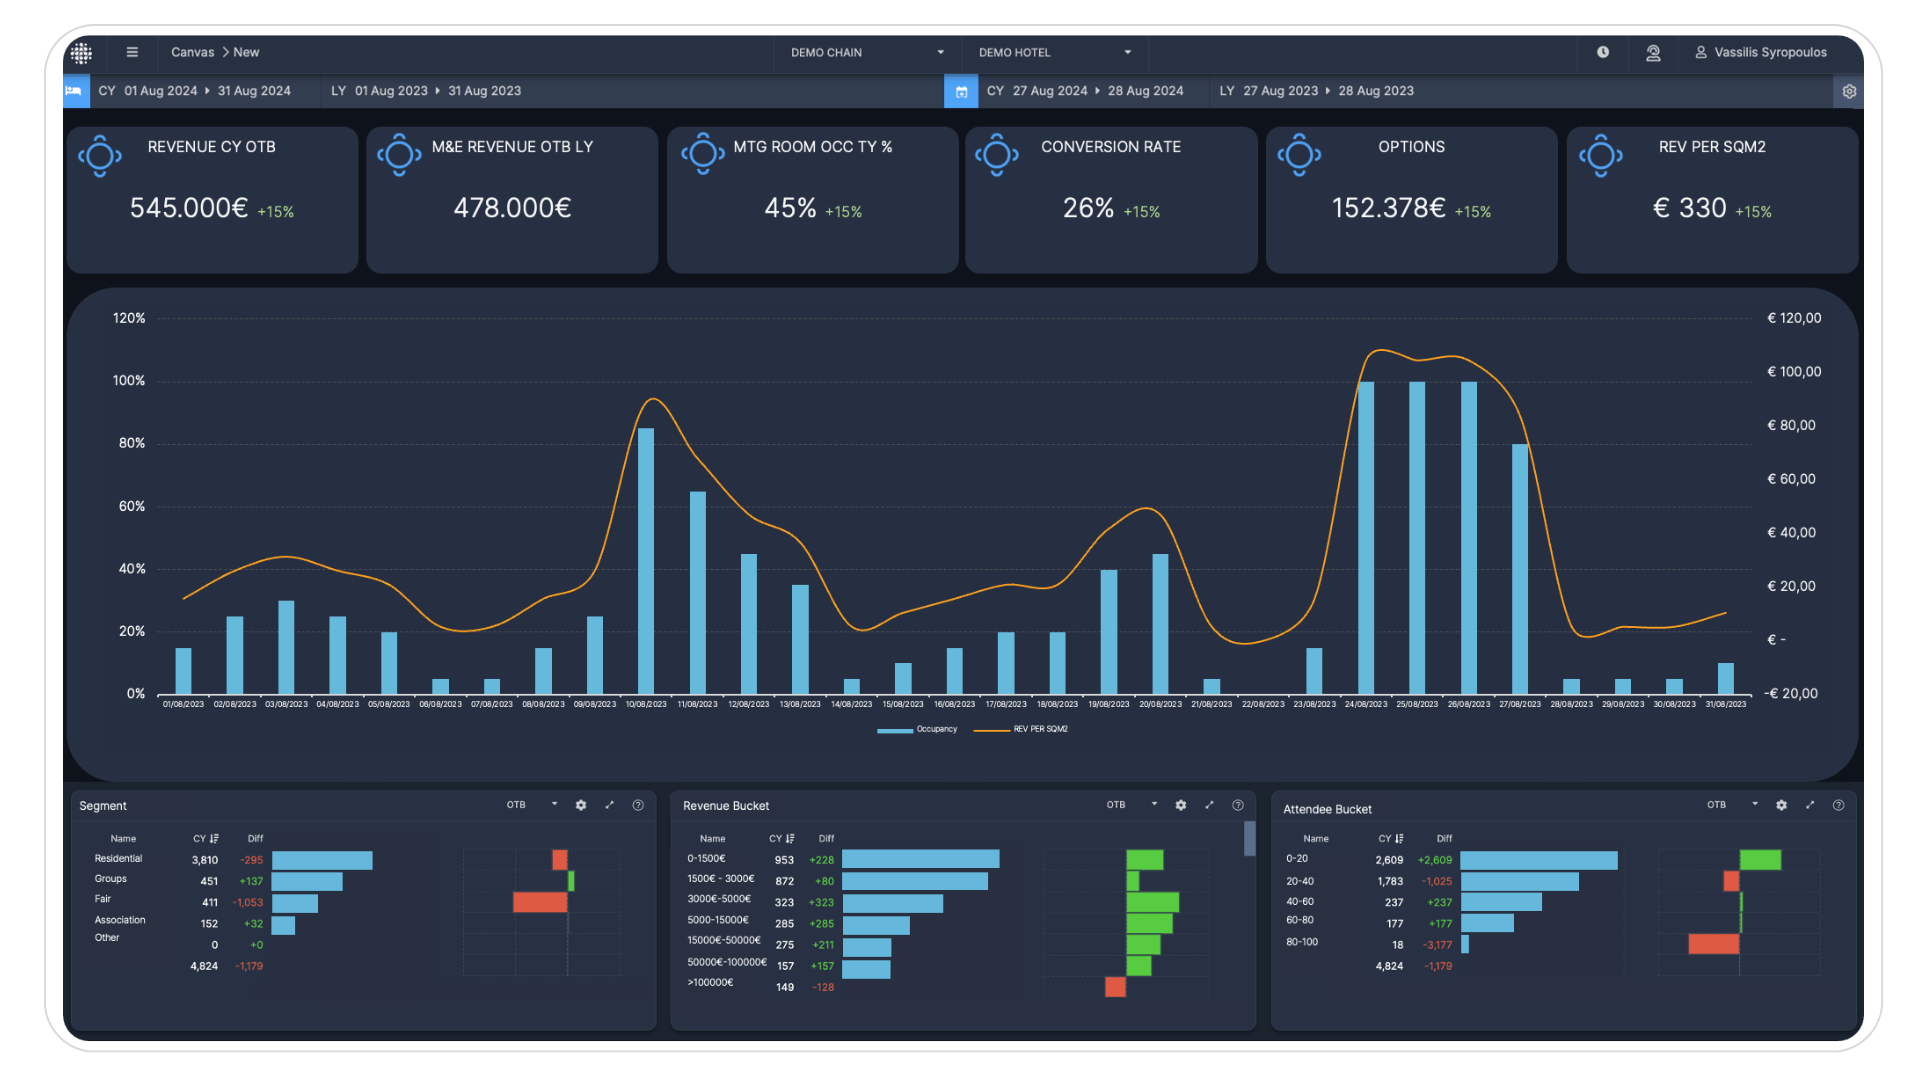
Meeting and events Analytics is making its way in Juyo.
This powerful integration with your Event Management System provides intuitive, in-depth analytics across key areas such as demand, performance, conversion, segmentation, meeting room occupancy, revenue per square meter, lead time, and more.
With this integration, Meetings & Events (M&E) will no longer be managed in a silo, but fully part of a holistic commercial strategy.
This Integration is powered by our daughter company Get Into More.

Data Platform
Accelerating insights with Connectivity, infrastructure and platform as a service
Data Platform Concept
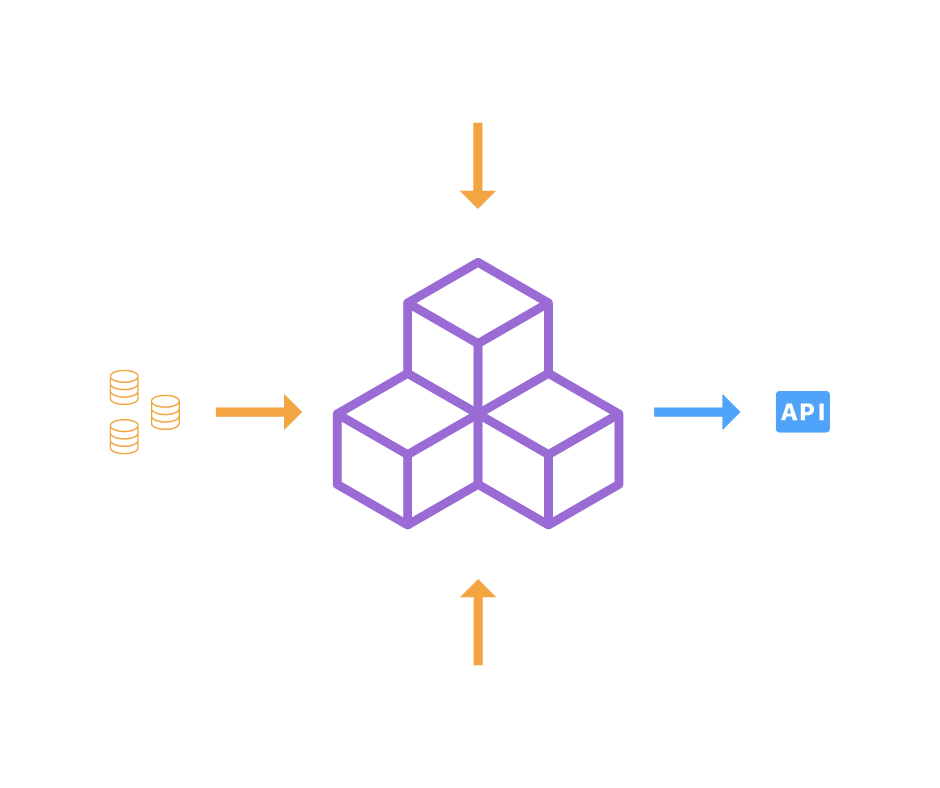
The Juyo Data Platform is separated from the Juyo Analytics visualization platform and allows Enterprise Hotel Groups to integrate the data delivered by Juyo through an API/Data Feed into their own visualization solution.
Juyo connects to a multitude of data sources such as PMS, Finance, Reviews, Pricing and many more.
Juyo exposes the data via a secure custom API or data Feed to an enterprise hospitality business application

Juyo Embed
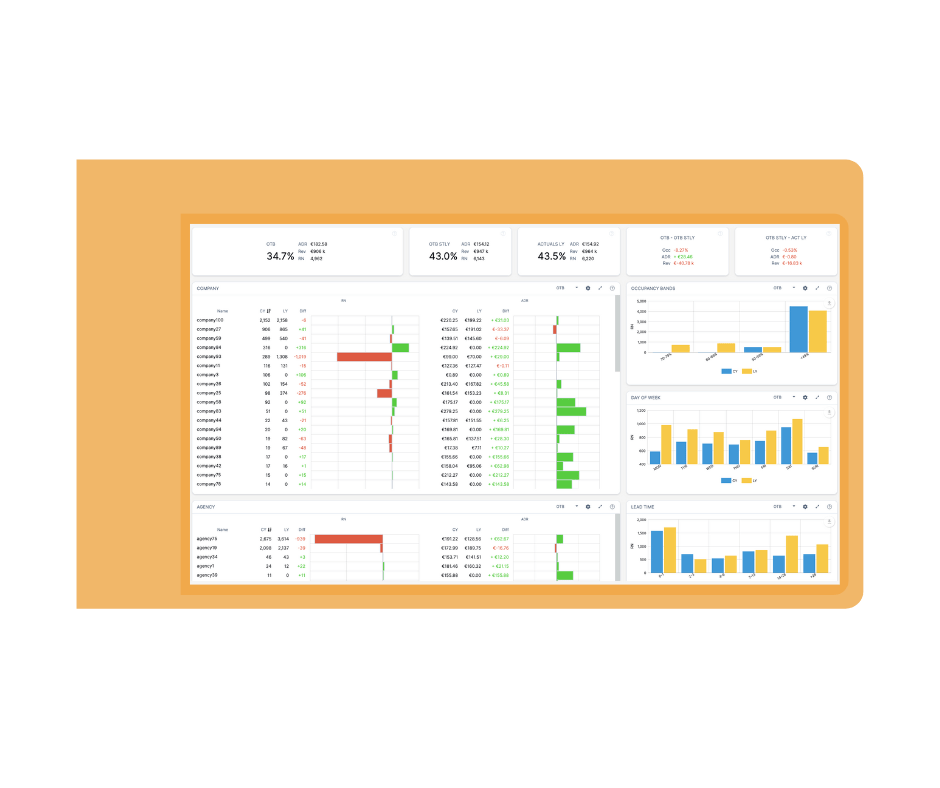
Juyo Embed delivers, interactive data visualization and advanced analytics directly into any web technology.
Juyo Embedded Analytics Concept
Embedded analytics software delivers, interactive data visualization and advanced analytics, including machine learning, directly into an enterprise business application
Ready to increase your speed and confidence in decision making?
Click below to book an introductory conversation and demo of Juyo Analytics. Let’s connect the dots.
